Composite photo of Temblor Range VTM photo 1936 by A.E. Wieslander and VTM retake 2013 by J. Gross. Mashup by H. Constable.
The Wieslander Vegetation Type Map (VTM) Project is a collection of vegetation maps, botanical plot sampling, plot maps, plant specimens and photos surveyed in the 1920s and 30s throughout California. In this remarkable effort, Forest Service crews mapped over 1/3 (16 million+ hectares) of the state. The data provide a snapshot of the state’s vegetation in the early 20th century, making the collection an invaluable resource for examining changes in land cover and use, and habitat restoration.
There are five main components to this collection: 1) vegetation maps, 2) plot data, 3) plot maps, 4) photos, and 5) botanical specimens. The digitation effort was a massive interdepartmental effort that involved two UC campuses and four departments.
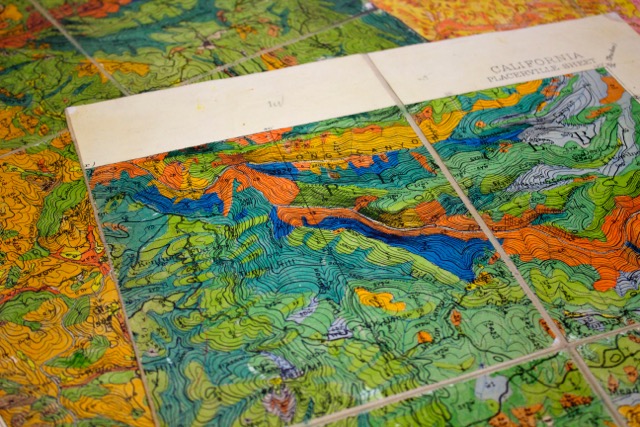
Vegetation maps are USGS topo maps that were colored by hand in the field to indicate vegetation types. Dominant vegetation type maps were mapped with a minimum mapping unit of 16 hectares by direct observation. The vegetation mapping scheme was driven by the identification of overstory species.
Researchers at the Information Center for the Environment at UC Davis, spearheaded by Jim Thorne, led the digitization of all the unpublished vegetation maps.
 |
 |
| Original hand colored VTM Topo Quad | Digitized Topo Quads |
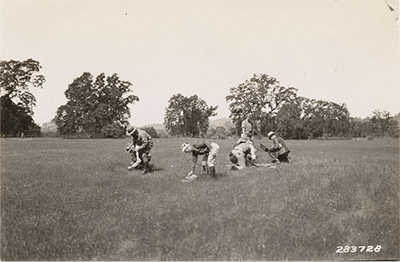
Plot data and Plot maps are the physical botanical sampling of subplots to ground-truth the vegetation maps. There were two types of plots per site, a brush/ground cover plot and tree plots.
The brush and ground cover plots were roughly 40m x 10m divided into 100 equal sections. VTM biologists recorded the one herb or shrub species that was dominant in each subplot. They then calculated percent cover for each species by summing the number of subplots containing each dominant species. They also recorded the average height of each species and the depth of the litter. The tree plots were 40m x 20m, similiarly divided and calculated.
The plot data available in the Ecoengine have been summarized to show the dominant species at each location.
The Kelly Lab in Environmental Science, Policy and Management Department (ESPM) at UC Berkeley led the plot map digitization and georeferencing. The Allen-Diaz Lab in ESPM cataloged all of the plot data, which the original surveyors recorded by hand, in the field, on thin sheets of paper in faint pencil.
 |
 |
| Digitized locations of VTM Plots | VTM botanists identifying plants |
Photographs have locality data and vegetation data associated with them. The VTM photo digitization was led by the Marian Koshland Bioscience and Natural Resources Library, and is now complete.
Partnering with the Biosciences Library, the Ecoengine team georeferenced 3,097 images and uploaded 3,347 photos as a collection into CalPhotos (a data source for the Ecoengine). Inspired by this rich archive, photographers have endeavored to take photo retakes, including Ecoengine programmer Joyce Gross, who has successfully located historic photo locations and has started the modern photo-retake collection.
 |
 |
| VTM Photo 286720, Kernville, CA October 1931
by Albert Wieslander |
VTM Photo 286720 Retake, Kernville, CA 2013
by Joyce Gross |
Herbarium specimens were collected for every species recorded on the vegetation maps and in the sample plots. See the Consortium of California Herbaria website to search for the records (http://ucjeps.berkeley.edu/consortium/). Many of the samples collected during the original VTM surveys are housed in Berkeley’s University and Jepson Herbaria.
For more details of the methods of data and digitization methods, see the VTM Website’s Data Description page.
The current VTM Project integrates the datasets to inform studies of global change. We have inititiated two such studies: 1) identifying 20th century changes in vegetation structure in coastal and southern California by comparing more recent USFS data to VTM data, and 2) identifying factors associated with vegetation diversity and identity.
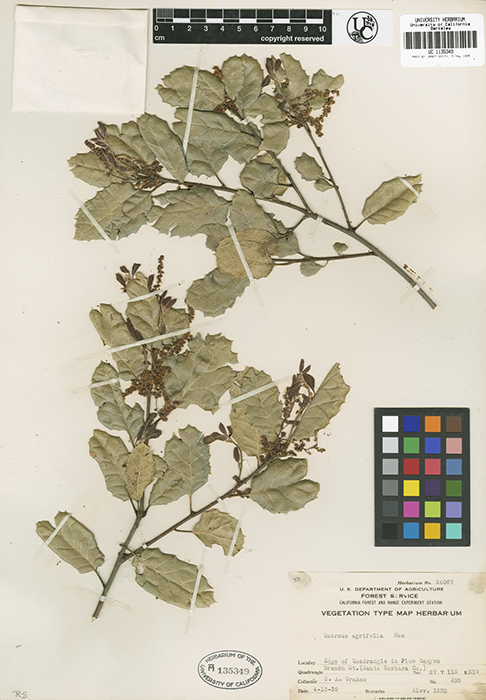 |
| Original Quercus agrifolia specimen collected during
VTM plot survey |
Relevant Publications
Mcintyre, P.J., J.H. Thorne, C.R. Dolanc, A.L. Flint, L.E. Flint, M. Kelly and D.A. Ackerly. (2015). Twentieth-century shifts in forest structure in California: Denser forests, smaller trees, and increased dominance of oaks. Proceedings of the National Academy of Sciences. 122(5) pp 1-6. DOI: 10.1073/pnas.1410186112
Ecoengine News!
Berkeley Natural History Museums
The BNHM collections are host to millons of vouchered specimes covering arthropods, amphibians, birds, reptiles, mammals, vascular plants, mosses, lichens, fungi, as well as fossils. Thanks to dedicated staff and generous funding these collections are actively being updated and transitioned to online. To assist these collections in the efforts to mobilize valuable data the Ecoengine team targeted specific specimens to digitize, catalog, and georeference.
Essig Museum of Entomology: Ticks (Ixodes sp.) and Bees (Apis sp.)
With Ecoengine funding, Essig’s Collections Manager Peter Oboyski hired multiple students to image, recurate, and database 700+ tick specimens collected in California over the last century. We hope these specimens will aid researchers in understanding the complex interactions between Sudden Oak Death (SOD), Lyme disease, ticks and tick hosts.
 |
 |
| Dermacentor variabilis photo by Joyce Gross | Anthidium manicatum photo by Joyce Gross |
Another group of organisims we focused on were California bees. A fellow Berkeley project is examining how bees, plants, and pollination activies might have changed in response to urbanization and agricultural land conversion. To provide them with more specimens to sample we georeferenced Apis melifera records and integrated Dr. Gordon Frankie’s bee collection comprised of 8,000+ specimens.
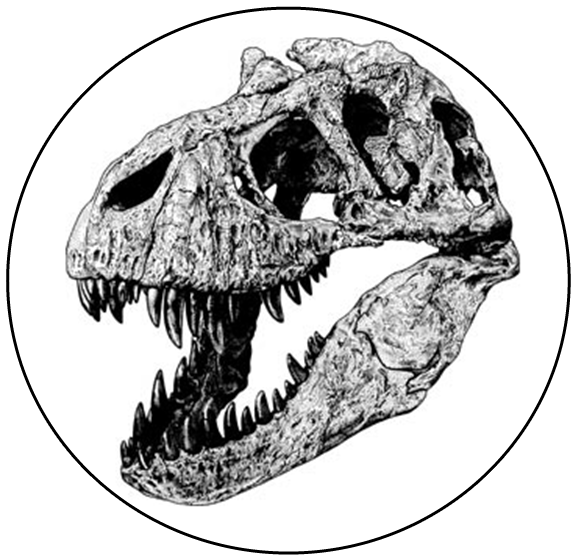
University of California Museum of Paleontology: Pleistocene Vertebrates and Invertebrates
(image of t rex?)
University of California and Jepson Herbaria: VTM Specimens
 Explore Tool Quick Guide
Compare Tool Quick Guide
Downloading Data from Explore
Bounding Box Searches from Explore
 Guide to Using the Ecoengine R package
Contact us with your suggestions and comments.
 |
| Thalasseus elegans photo by Glenn and Martha Vargas |
Principal Investigators
- Rosemary Gillespie, Professor, Department of Environmental Sciences, Policy & Management
- Charles Marshall, Professor, Department of Integrative Biology
- David Ackerly, Professor, Department of Integrative Biology
- Maggi Kelly, Professor, Department of Environmental Sciences, Policy & Management
- Michelle Koo, Biodiversity Informatics & GIS Staff Curator, Museum of Vertebrate Zoology
- Kevin Koy, Director, Berkeley Institute for Data Science
- Craig Moritz, Professor, Research School of Biology (Australian National University)
- Mary Power, Professor, Department of Integrative Biology
Staff & Engineers
- Heather Constable, Project Coordinator
- Brian Galey, Senior Web Application Developer, Geospatial Innovation Facility
- Joyce Gross, Programmer, Berkeley Natural History Museums
- Sarah Hinman, Project Coordinator
- Shufei Lei, Graduate Student Researcher
- Patrick McIntyre, Postdoctoral Scholar
- Yugarshi Mondal, Programmer
- Shruti Mukhtyar, Web Application Developer, Geospatial Innovation Facility
- Ginger Ogle, Programmer, Berkeley Natural History Museums
- Giovanni Rapacciuolo, Postdoctoral Scholar
- Jessica Rothery, Data Mobilization Lead
- Falk Schützenmeister, Web Application Developer, Geospatial Innovation Facility
- Nancy Thomas, Director, Geospatial Innovation Facility
Partners (more)
Larrimore Graphic Design
- Sterling Larrimore
rOpenSci
- Karthik Ram, Berkeley Initiative in Global Change Biology Scientist
Stamen Design, LLC
- Dan Rademacher, Project Manager
- Kai Chang, Programmer
- Eric Gelinas, Programmer
Macroeco
- Justin Kitzes
- Mark Wilber
Data Partners
Essig Museum of Entomology
- Peter Oboyski, Collections Manager & Senior Museum Scientist
Museum of Vertebrate Zoology
- Carla Cicero, Staff Curator Ornithology
- Ann Chang, AmphibiaWeb
University of California Museum of Paleontology
- Diane Erwin, Museum Scientist (Paleobotany)
- Pat Holroyd, Museum Scientist (Vertebrate Collections)
University and Jepson Herbaria
- Staci Markos, Assistant Director for Development and Outreach
- David Baxter, Biodiversity Informatics Manager
Department of Environmental Science Policy & Management
- Gordon Frankie, Professor
- Robert Lane, Professor
Department of Geography
- Roger Byrne, Professor
- John Chiang, Professor
Angelo Coast Range Reserve
- Collin Bode, Critical Zone Observatory Data Manager
- Peter Steel, Reserve Manager
- Charles Post, Graduate Student
Sagehen Creek Field Station
- Jeff Brown, Station Manager
- Faerthen Felix, Assistant Manager
Hasting Natural History Reservation
- Vincent Vogeli, Reserve Director
- Mark Stromberg, Retired Reserve Director
Blue Oak Ranch Reserve
- Mike Hamilton, Reserve Director
University of California, Davis, Information Center for the Environment
- Jim Thorne, Research Scientist
- Thuy N’Goc Le, Research Assistant
Graduate and Undergraduate Digitization Assistants
- Arif Ali
- Jareth Beckelman-Groves
- Isaac Brazil
- Kristine Cueva
- Sarah Edwards
- Tammy Dong
- Ryan Hardenburger
- Anna Hiller
- Eric Holt
- Evangeline Hsiao
- Preethi Kandhalu
- Sky Korber
- Taylor Winchell
- Alison Young
- Crystal Lee
- Jonathan Ly
- Vickie Ly
- Kelsey Lyberger
- Melissa Mast
- Emma Marshall
- Natalie Mezaki
- Jina Moon
- Monique Picon
- Molly Raven
- Scott Simono
- Maggi Soun
- Sam Swayze
- Carolyn Sy
- Hannah Yokum
 |
| Students georeferencing in the Annie Montague Alexander
Map Room at the MVZ. Photo by M. Koo. |

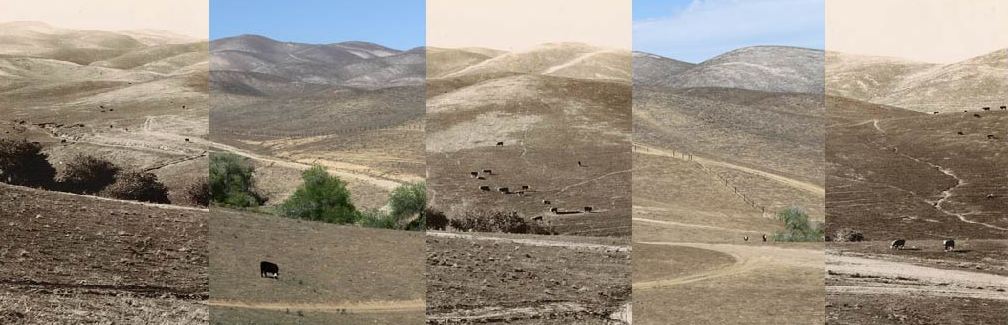
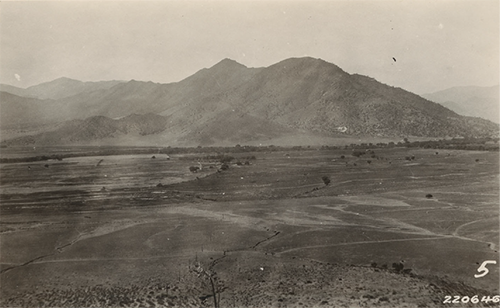
Cook Peak near Isabella (1927) superimposed with Lake Isabella (2013), Kernville, California. Mashup by H. Constable.
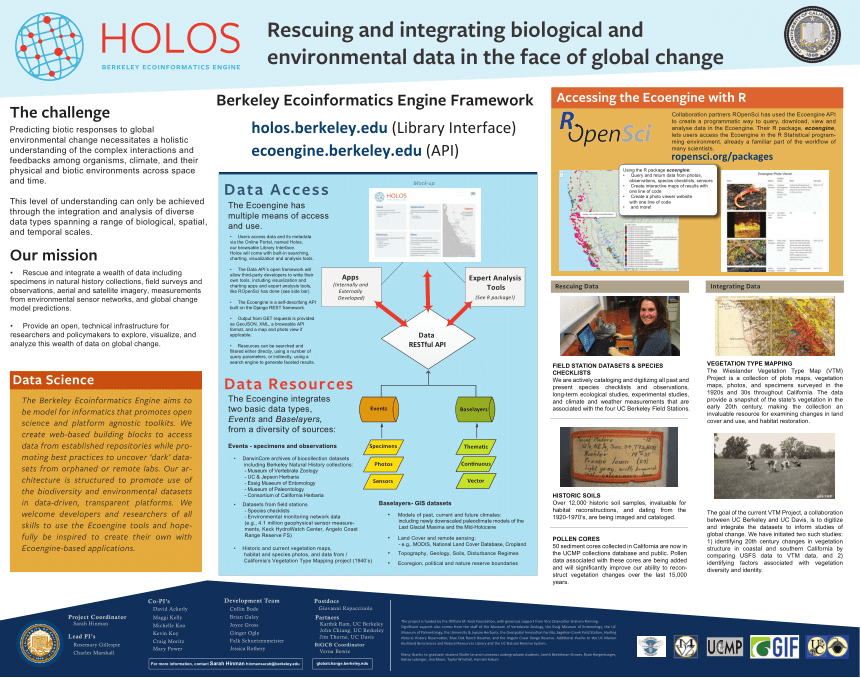
Holos: Mobilizing Data for Understanding Global Change
Overview
Predicting biodiversity responses to global environmental change is a multi-faceted challenge, which requires a holistic understanding of the complex interactions and feedback among organisms, climate, and their physical and biotic environments across space and time.
Holos aims to digitize and aggregate many diverse biological and environmental collections into the Berkeley Ecoinformatics Engine (‘Ecoengine’), a web service that can be searched and visualized via graphical tools: Explore, Compare, and other Applications. The data in the Ecoengine is global in scope, and since much of the data is sourced from the University of California museums, reserves and partners, the data coverage for California is very good.
We aim to be a model for informatics that promotes open science and agnostic toolkits. Our architecture is structured to promote use of integrated biodiversity and environmental datasets in data-driven, transparent platforms.
We intentionally separate the data collection from the application interfaces to allow easy, customizable, extensions of how and what data are served. This allows new data to be continually added to and curated by participating museum collections. We achieve this through the Ecoengine’s API, or web services, which is incorporated into online web tools, portals and desktop applications allowing access and dynamic visualization.
We welcome developers and researchers of all skills to use the Ecoengine tools and hopefully be inspired to create their own useful tools with Ecoengine’s application.
Origins
The Ecoengine was imagined by UC researchers in need of a tool to access and explore integrated biological and environmental data over space and time. Such a tool would pull from a diversity of online data repositories and display them in an easy-to-use, map-based interface to satisfy the growing demand for a holistic understanding of global change science.
Thanks to the Berkeley Initiative in Global Change Biology and to generous funding by the William M Keck Foundation in 2012, our team built a data-driven platform using an Application Programming Interface (API) that taps an array of data streams, some of which were digitized exclusively for the Ecoengine.
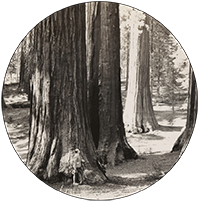
These inaugural datasets are diverse spanning taxonomic groups and time spans, from fish and amphibians to lichens and redwoods, from modern to Pleistocene. We describe these UC Berkeley resources mobilized in the first project in Data Discovery, however, the architecture of the Ecoengine is not specific to these collections and our extent is global.
We have benefited greatly from existing biodiversity digitization and aggregation projects including GBIF, iDigBio, Vertnet, CalBug, Consortium of California Herbaria, among others as well as innovative, geospatial visualization projects like Cal-Adapt and NASA Earth Exchange. The Ecoengine presents a unique combination of features, making it an invaluable tool for biodiversity and global change research:
- Biological data from disparate sources and collecting methods are integrated using a common set of core fields;
- Environmental and biolotical data are combined within the same mapping interface;
- Spatial and temporal data attributes are emphasized, facilitating the exploration and analysis of spatio-temporal trends in both biodiversity and the environment.
Please contact us if you have questions or comments!
 |
||
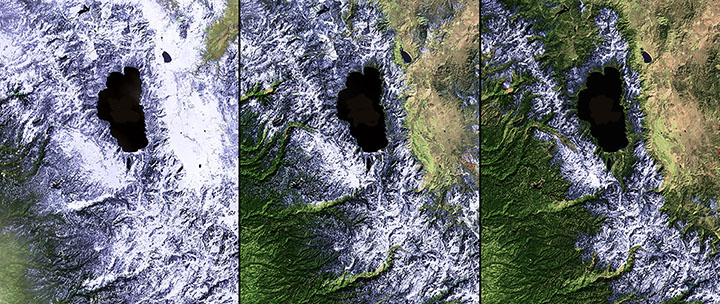
Satellite imagery of Sierra Nevada snow pack around Lake Tahoe, 2011, 2013 and 2014. Image by USGS and NASA
Studying global change in a holistic manner requires the understanding of evolutionary processes in the environment from the past, as well as providing the predictive power to forecast and model changes into the future. The Nasa Earth Exchange (NEX) platform provides Global Daily Downscaled Projections (GDDP) data for future climate models. These models were developed in support of the Intergovernmental Panel on Climage Change (IPCC)’s assessment of several models of future climate predictions based on different scenarios of CO2 emissions. The Ecoengine will incorporate these rasters as base layers for the Explore interface in the near future. The full data set can be downloaded here.
Yugaroshi Mondal, a member of the Ecoengine team, is assiting on the development of high-resolution climate models from the Last Glacial Maximum (LGM) and mid-Holocene. These data will reconstruct temperature and precipitation profiles over the continental United States, and used to compute bioclimatic variables for the purpose of species distribution modeling. More information on the project can be viewed here on figshare.
Publications
- Mcintyre, P.J., J.H. Thorne, C.R. Dolanc, A.L. Flint, L.E. Flint, M. Kelly and D.A. Ackerly. (2015). Twentieth-century shifts in forest structure in California: Denser forests, smaller trees, and increased dominance of oaks. Proceedings of the National Academy of Sciences. 122(5) pp 1-6. DOI: 10.1073/pnas.1410186112
- Mondal, Y., Chiang, J., Farley, S., and M.S. Koo. (2015). Statistical Downscaling of Last Glacial Maximum and Mid-Holocene Climate Simulations Over the Continental United States. (in review)
- Rapacciuolo, G., D.B. Roy, S. Gillings and A. Purvis. (2014). Temporal validation plots: quantifying how well correlative species distribution models predict species range changes over time. Methods in Ecology and Evolution. 5(5) pp 407-420. DOI: 10.1111/2041-210X.12181
Select Presentations
- Kelly, M. (2015). HOLOS Ecoinformatics Improve Predictions of the Ecological Impacts of Climate Change. Panel: Advances in Earth Observation: Enabling New Insights into Global Environmental Change. American Association for the Advancement of Science (AAAS) Annual Meeting, San Jose, California. February 12-16, 2015.
- Kelly, M (2014). Place, Space and Time: Rescuing and Integrating Biological and Environmental Data in the Face of Global Change. Keynote Lecture. NASA OpenNEX Virtual Workshop and Challenge, Sunnyvale, California. August 7, 2014.
- Rapacciuolo, G. (2014) Uses and misuses of unsystematic historic data sources for examining species’ distribution changes across space and time. Understanding biodiversity dynamics using diverse data sources Conference, Australian National Museum, Canberra. April 22-24, 2014.
- Gillespie, R. (2013). Eco-Informatics. Launch of the Berkeley Institute for Data Sciences (BIDS), University of California, Berkeley, California, December 13, 2013.
- Koo, M.S. (2013). Place, Space, and Time: Rescuing and Integrating Biological and Environmental Data in the Face of Global Change. Invited presentation at GIS Day, sponsored by Bay Area Automated Association and UC Berkeley, Berkeley, California. November 20, 2013.
- Marshall, C.R., *Kelly, M., *Koo, M.S., *Koy, K. (2013) Place, Space, and Time: Rescuing and Integrating Biological and Environmental Data in the Face of Global Change. Invited presentation in Data Science Lecture Series, UC Berkeley, November 15, 2013.
- Koy, K. (2013). Cal-Adapt: Exploring California’s Climate Change Research. Bay Area Automated Mapping Association, September Educational Meeting: Geospatial Tools in Climate Change Planning, Oakland California, September 26, 2013.
- Koy, K. (2013). Understanding the Natural World Through Spatial Data.DataEDGE Conference, University of Berkeley School of Information, Berkeley, California. May 30-31, 2013
- Koy, K. (2013). Cal-Adapt: Exploring California’s Climate Change Research. North Bay GIS Field Day, Santa Rosa, California. May 30, 2013.
- Koo, M.S. (2012). The Big Data Revolution in Natural History Museums. Invited talk for East Bay Science Café, Berkeley, California. October 3, 2012.
- Koo, M.S. (2012).The Berkeley Ecoinformatics Engine, a project in the Berkeley Initiative in Global Change Biology. Invited presentation at the 14th Workshop of Genomics Standards Consortium, Oxford, UK, 17-19 September 2012.
Select Posters
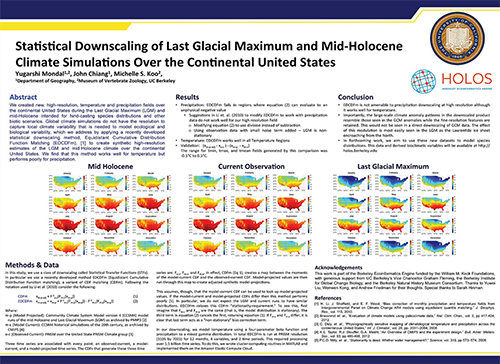
- Mondal, Y., Chiang, J., and M.S. Koo (2014). Statistical Downscaling of Last Glacial Maximum and Mid-Holocene Climate Simulations Over the Continental United States. American Geophysical Union’s Fall Meeting, San Francisco, California. December 15-19, 2014.
- Mondal, Y., Chiang, J., and M.S. Koo (2014). Statistical Downscaling of Last Glacial Maximum and Mid-Holocene Climate Simulations Over the Continental United States. National Center for Atmospheric Research’s 4th International Workshop on Climate Informatics, September 25-26th, 2014.
- Rapacciuolo, G. (2014). Rescuing and integrating biological and environmental data in the face of climate change, Holos: Berkeley Ecoinformatics Engine. Understanding biodiversity dynamics using diverse data sources conference, Australian National Museum, Canberra, 24 April 2014.
- Koo, M.S. (2013) An Ecoinformatics Engine for Understanding Biotic Response to Global Change. International Biogeography Society, Miami, Florida January 9-13, 2013.
Please see our Tutorials for a quick introduction to the user interfaces.
See the Q&A below for more information.
Explore Tool
- How do you download data from the Explore tool?
- Why are there so few points plotted on the map when there are so many records available?
- Why doesn’t back button in my browser work?
- What are the red, blue and orange squares?
Compare Tool
- What is the difference between Explore and Compare?
- What is a GeoJSON URI?
- What are the Point, Polygon and Hexagon options?
- Why do the record counts keep changing?
Explore Q&A
- Observations – See next question: What are Observations?
- Photos – Images without species identified, such as landscapes. Currently these can only be queried directly through the Ecoengine API or through Calphotos.
- Layers – GIS layers in the map display. These can be turned on and off in the right hand legend under Boundaries or Basemap.
- Specimens – wet and dry biological collections of plants, animals and fungi from multiple data sources.
- Fossils – fossilized specimens of vertebrates, invertebrates, plants and microfossils from UCMP.
- Vegetation Type Mapping data – historical records of plant occurrences from the VTM project. These are listed under VTM Vegetation Features and Plot Survey.
- Photo – from Calphotos with identified species are given a species occurrence record. This is separate from Photos under Resources without species identified.
- Checklists – of plants, animals and fungi from the UC Natural Reserves. Each species in a checklist was given a separate data record with coordinates from the center of the originating field stations. To get checklists by natural reserve, sort the data table by checklist number or do a Bounding Box search.
- Observations – are sound recordings or video of species. The media are linked to these records through the originating institution.
Q: What data are displayed for each record?
A: For Observations, these are the available fields:
- associated_resources
- begin_date
- catalog_number
- clss
- collection_code
- coordinate_uncertainty_in_meters
- country
- county
- earliest_period_or_lowest_system
- end_date
- family
- genus
- geojson
- geometry
- individual_count
- infraspecific_epithet
- institution_code
- kingdom
- last_modified
- latest_period_or_highest_system
- life_stage
- locality
- maximum_depth_in_meters
- maximum_elevation_in_meters
- minimum_depth_in_meters
- minimum_elevation_in_meters
- observation_type
- order
- original_id
- phylum
- preparations
- record
- recorded_by
- remote_resource
- scientific_name
- sex
- source
- specific_epithet
- state_province
- url
- water_body
Q: How do you download data from the Explore tool?
“View data or export as CSV, JSON, or GeoJSON from the Berkeley Ecoinformatics Engine”
Q: Why are there so few points plotted on the map when there are so many records available?
1) Check the Page Size at the top of the data table. The default is set to 100 records, therefore only 100 records are displayed and plotted. You can change the page size to display more records. If they have latitude and longitude, they will plot on the map.
2) The data might not be geoferenced. Check the Filters on the left for Georeferenced = True. This is the full number of records that have geographic coordinates in your query.
3) The records may have the same or very similar geographic coordinates. Zoom in to see if the points are overlaid and appear as one record.
Q: Why doesn’t back button in my browser work?
Q: What are the red, blue and orange squares?
Compare Q&A
Q: What is the difference between Explore and Compare?
A: Explore allows you to search all of the data in the Ecoengine by searching by keyword or date, by filtering down to a subset of interest, or using a bounding box search in the map interface. Goereferenced specimens will be plotted on the map and you can view the points with different types of data, backgrounds, boundaries or footprints. Explore allows you to download the data from the records and export for further analysis.
Compare is a mapping tool that allows you to view several sets at a time. You can query the Ecoengine in Compare using the keyword search, or import search results directly from Explore. Compare is particularly useful for comparing the distribution of species occurrences, building, customizing and sharing maps online.
Q: What are the Point, Polygon and Hexagon options?
A: These are options in the map legend that display data in different ways.
The Point option plots each data record as a dot. However, if there are multiple records from the same location, they will be stacked on top of eachother and multiple points will appear as only a single point.
The Polygon option allows you to see exactly how many records are in a geographic area. The Compare Tool does this by grouping records together in a Minimum Convex Polygon (MCP). You’ll notice that the polygon splits into smaller groups as you zoom in. Note that this is not a statistical calculation for home range, but is a useful visualization method for plotting many records at once.
The Hexagon option is another MCP visualziation tool that groups records from the same area into hexagon shapes. Similarly, these hexagons adjust in size as you zoom in. You can also adjust the hexagon radius using the slider.
Both the Polygons and Hexagons are translucent, allowing the viewer to see areas of overlap between data layers.
Q: Why do the record counts keep changing?
A: The Compare Tool will load all of the records in a query, which may take some time. The numbers will continue to update until all records are loaded.
If the information you seek is not here, please feel free to contact us.
Professor Roger Byrne and his lab at UC Berkeley have worked for many years to reconstruct past environments and ecological change by collecting and studying fossil pollen found within sediment cores. They have collected over fifty sediment cores across California and western North America, from which representative pollen slides are now in the UCMP collection. Critical data associated with these slides is being added to the UCMP database, and will significantly improve our ability to reconstruct vegetation changes over the last 15,000 years.
The pollen core data can be searched in the Explore tool by faceting on Observation Type = Fossil, Georeferenced = True, Country = United States, State_province = California, Kingdom = Plantae, or by using this link. Each data record will link directly to the UCMP database.
The Byrne team has recently released CalPayln II, an interactive data visualization site to produce stratigraphic paleoproxy plots and pollen diagrams at http://calpalyn.berkeley.edu/.
 |
| Sediment cores photo by Hannes Grobe CC 3.0 |
We selected several individuals and groups to work with who shared our vision for clean design, data rich content and the desire to communicate scientific content as broadly as possible.
Sterling Larrimore Graphic Design

Sterling Larrimore was instrumental for shaping our brand, honing our aesthetic and ultimately created our logo for Holos. She outlines her vision for the logo in her infographic.

- Karthik Ram, co-founder of ROpenSci and creator of the ecoengine R package.
At rOpenSci we are creating packages that allow access to data repositories through the R statistical programming environment that is already a familiar part of the workflow of many scientists. Our tools not only facilitate drawing data into an environment where it can readily be manipulated, but also one in which those analyses and methods can be easily shared, replicated, and extended by other researchers.
We develop open source R packages that provide programmatic access to a variety of scientific data, full-text of journal articles, and repositories that provide real-time metrics of scholarly impact. Visit our packages section for a full list of production and development versions of packages.
![]()
- Dan Rademacher, Project Manager
- Kai Chang, Programmer
- Eric Gelinas, Programmer
Since 2001, SF-based Stamen Design has shown consistent design and technical leadership in live data visualization and interactive mapping.
We pursue clients around the world who are ready to communicate seriously (or playfully) about their data with the public, and our experimental artistic work is in the permanent collection of the Museum of Modern Art. Building and contributing to open source software projects is a key part of Stamen’s practice.
We’ve found a way of working that lets all three of these areas support and reinforce each other. Commercial work sustains our business. Art & experimentation keep us on the cutting, bleeding edge. And we pay it all forward with open source development and education.
Macroeco: Ecological pattern analysis in Python
- Justin Kitzes
- Mark Wilber
Macroeco provides a comprehensive set of functions for analyzing empirical patterns in ecological data, predicting patterns using theory and models, and comparing empirical patterns to theory. Many major macroecological patterns can be analyzed using this package, including the species abundance distribution, the species and endemics area relationships, several measures of beta diversity, and many others.
 Berkeley Sensor Database
The Ecoengine is connected to an environmental sensor array housed Angelo Coast Range Reserve. The array was first established as part of a Keck Foundation grant for the project Keck Hydrowatch and has been maintained and expanded through various other projects including the NSF-funded, Eel River Critical Zone Observatory.
The data are stored in Berkeley’s Sensor Database, which contains over 400 million measurements across 48 variables, including temperature, precipitation, and CO2, and is updated every 15 minutes.
As more Field Stations come online and have their data sent to the Sensor Database, then these data will be available in the Ecoengine API and its tools.
![]() See an example of the sensor data visualization powered by the Ecoengine.
See an example of the sensor data visualization powered by the Ecoengine.
 Specimens from the VTM Collection
To achieve the full digitization of the Vegetation Type Mapping (VTM) collection (photos, maps, plots, and specimens), the Ecoengine partnered with the University and Jepson Herbaria to georeference VTM specimens within their collection. In total, 7,293 specimen records were corrected or were assigned new coordinates. The Consortium of California Herbaria (CCH) database added a “Vegetation Type Map specimen” checkbox to their interface to allow users to easily identify this collection.
 |
| “Studying grasses in Nevada County” photo by C. Ray Clar, 1933. |
…
…
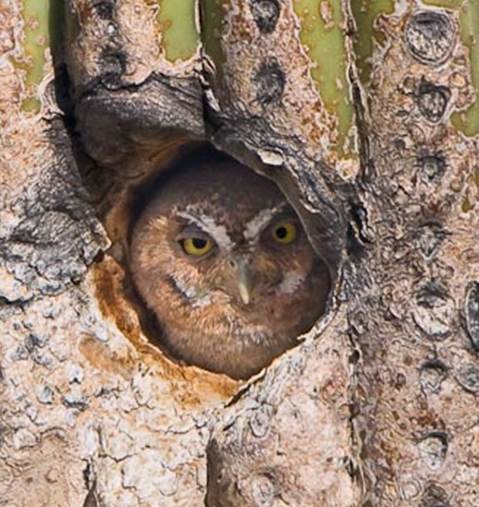 |
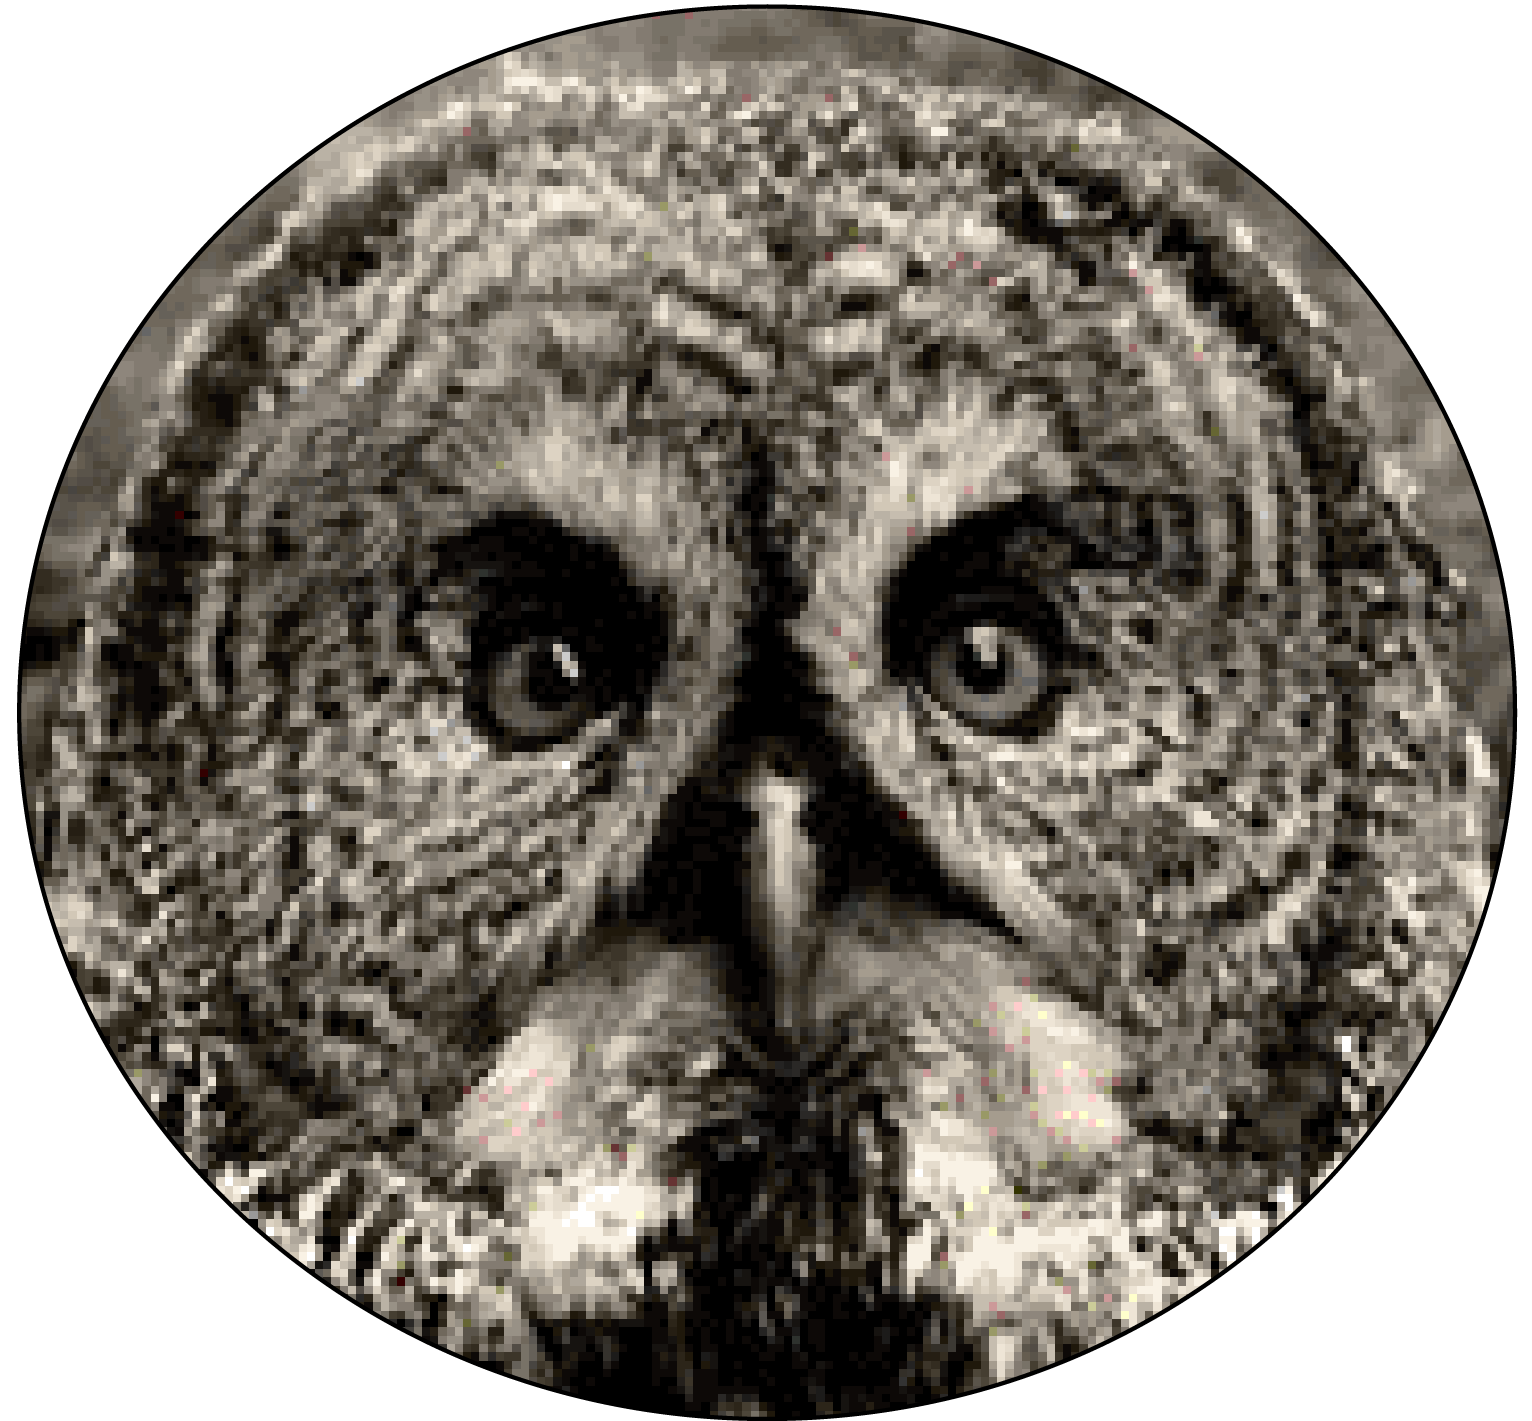
| Micrathene whitneyi (Efl Owl) by Calphotos contributor Steve Zamek |
Photographs with Locality Information
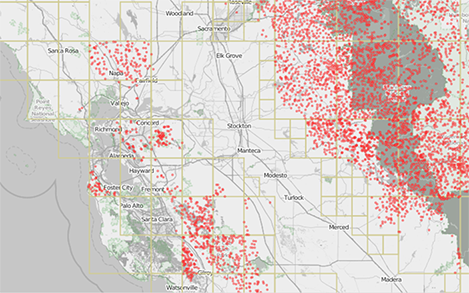
CalPhotos has published over 470,000 digital photographs of plants, animals, fungi, landscapes, people and cultural subjects since 1995. Anyone can search this database by scientific name, common name or any of the associated data fields. All photos feature metadata, the original photographer, use and attribution information.
Many of these photos include species information with locality or GPS coordinates, which is valuable to researchers.The Ecoengine team georeferenced 53,121 photos in the Calphotos repository, which account for approximately 17% of all species observations in the collection. This collection is accessible and easy to explore through the Ecoengine under Observation Type: Photos.
The team also added 3,347 historical site photos from the Wieslander Vegetation Type Mapping project. This has inspired some photo retakes of historical sites to show how the environment has changed, or remained the same, over the last 100 years.
 |
 |
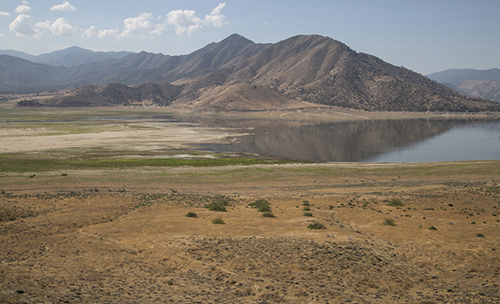 |
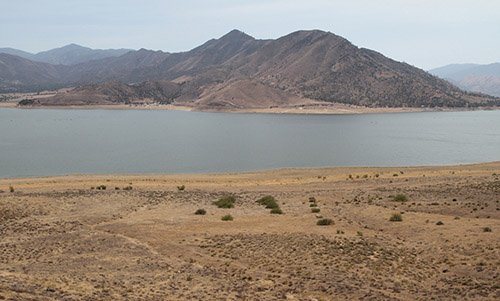
| South Fork Valley near the town of of the Isabella July 1927. Lake Isabella was created in 1953 by the damming of the Kern River. VTM Photo by L.M. Correll. | Lake Isabella June 2013, VTM retake by J. Gross | Lake Isabella April 2015, VTM retake by J. Gross |
 Soil biogeochemistry is intimately connected to the underlying geology, climate, hydrological cycle, as well as biota and their ecological interactions. UC Berkeley is one of the founding centers of the study of the biogeochemical forces that form soils, and is host to an extensive collection of samples from across California from the early 20th century.
This collection was the product of decades of soil samples throughout the state by numerous researchers, scientists and public officials from the 1920s to the 1980s. The majority of the collection was built in the 1950s and 1960s as part of the California Soil Vegetation Survey, which was supported by the California Department of Forestry and the Pacific Southwest Forest and Range Experimental Station.
Prior to the Ecoengine project, this collection was all but forgotten; stored deep in the Regatta Facility in Richmond, California, untouched for many years. None of the samples were cataloged or organized and were essentially unavailable to researchers. Ron Amundson, Professor and Chair, Department of Environmental Science, Policy and Management, was instrumental in orientating the Ecoengine Team and giving us access.
With extensive work from numerous dedicated undergraduate assistants, we labeled and imaged each jar, cataloged the label contents (depth, date, collector, location, soil series name, etc.), and then georeferenced those with sufficient locality information. We now have a catalog of 14,027 records – 10,311 of which are now searchable through this public portal: http://bigcb.berkeley.edu/soil/.
 |
 |
|
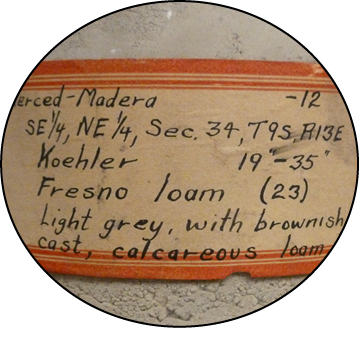
| Soil collection at the UC
Berkeley’s Regatta Facility (Richmond, CA) |
The Ecoengine’s soil crew posing
with newly catalogged samples |
![]()
VertNet and Holos
The Ecoengine Project and VertNet are both biodiversity informatics initiatives out of UC Berkeley with the shared goal of providing open access to natural history data. These projects are developed with the same interoperable data standards, norms and conceptual guidance. The VertNet portal provides access to over 17 million specimen records and observations of vertebrate species from 274 collections around the world. In addition to specimen records, the Ecoengine data providers provide access to species occurrence data from all of the Berkeley Natural History Museums (BNHM), the University of California Natural Reserve System (UC NRS), environmental sensor data, photographs, soil types, vegetation type mapping, climate and ecoregion data. Both projects are global in scope.
Data Publishing
Collection data are published using the Integrated Publishing Toolkit (IPT), a tool designed to map different database formats to the standard Darwin Core format. A Darwin Core Archive is a copy of the collection data in a zip file that contains a comma delimited file (CSV) the occurrence records and a metadata file that describes the dataset. The Darwin Core Archive is published to a public URL, which makes the data set accessible to other biodiversity platforms, such as GBIF and the Ecoengine.
The Holos team will be contacting collections on the VertNet network to discuss adding these data to the Ecoengine. As with all data aggregation projects, provenance should be maintained and properly attributed to the originating institution. For more information on how to properly cite data, please see the VertNet data norms page.

-
What is Holos: Berkeley Ecoinformatics Engine?
-
How can I use Holos?
-
What types of data are accessible via Holos?
-
What are the policies for using data in Holos?
-
Can I create my own application using Holos data?
-
How can I see my own data with Holos?
What is Holos: Berkeley Ecoinformatics Engine?
Holos: Berkeley Ecoinformatics Engine is a biodiversity informatics distributed data portal and toolkit for accessing and visualizing integrated boiological and environmental datasets to address questions of global change biology.
Holos aims to be model for informatics that promotes open science and platform agnostic toolkits. We create web-based building blocks to access data from established repositories while promoting best practices to uncover ‘dark’ datasets from orphaned or remote labs. Our architecture is structured to promote use of the biodiversity and environmental datasets in data-driven, transparent platforms. We welcome developers and researchers of all disciplines to use the Ecoengine tools and hopefully be inspired to create their own with Ecoengine-based applications.
On our main page holos.berkeley.edu, we have two interactive tools which require no programming:
- The EXPLORE tool allows users to query specimens, observations, photos and more. Searches can also be refined by date or by using our faceted filters, which include geographic and taxonomic categories, georeferenced or not, and observation type. Lastly, the mapping interface and toolbox on the right provides users with geospatial layers to build upon and overlay as well as geographic boundaries to hone searches.
- The COMPARE tool enables users to examine multiple species from a range of different data sources. The same boundaries, environmental layers and basemaps available in the EXPLORE are also available here.
You can also access Ecoengine data via R Statistical programming language with rOpenSci’s Ecoengine R package.
Developers are directed to the documentation on how to use our Ecoengine API.
What types of data are accessible via Holos?
Holos taps a wide range of biodiversity and environmental datasets. The full information about each provider can be found on the Data Sources and Participating Instutions Pages. Here is a summary list of the data sources.
- Berkeley Sensor Database, University of California Natural Reserve System
- Berkeley Soil Collection, Department of Environmental Science Policy and Management, University of California Berkeley (coming soon)
- California Academy of Sciences Botany
- California Academy of Sciences Entomology
- California Academy of Sciences Herpetology
- California Academy of Sciences Ichthyology
- California Academy of Sciences Ornithology
- Calphotos, Berkeley Natural History Museums, UC Berkeley
- Consortium of California Herbaria, The University and Jepson Herbaria, UC Berkeley
- Essig Museum of Entomology, UC Berkeley
- LACM Vertebrate Collection, Natural History Museum of Los Angeles County
- Museum of Vertebrate Zoology (MVZ) Bird Collection, UC Berkeley
- MVZ Bird Observations, UC Berkeley
- MVZ Egg and Nest Collection, UC Berkeley
- MVZ Herpetological Collection UC Berkeley
- MVZ Herpetological Observations UC Berkeley
- MVZ Hildebrand Collection UC Berkeley
- MVZ Mammal Collection UC Berkeley
- MVZ Mammal Observations UC Berkeley
- UC NRS Field Station Checklist Berkeley Initiative in Global Change Biology, UC Berkeley
- UC Museum of Paleontology
- Wieslander Vegetation Type Mapping Project, Department of Environmental Science Policy and Management, UC Berkeley
What are the policies for using data in Holos?
For biodiversity data, such as specimens, fossils, herbaria sheets and other species occurrences, we follow the guidelines and best practices developed and refined by Canadsys and VertNet. For publication and distribution, each data source used should be cited with the data set name, publisher or affiliated institution, a link to the resource and the data accesssed.
All of the data in the Ecoengine are listed on the Data Sources Page: https://holos.berkeley.edu/resources/datasources/
Proper citation of a record should include:
- [dataset name] . [affiliate Institution] . [link to dataset] (accessed on [date])
Examples:
- [Berkeley Sensor Database].[University of California Natural Reserve System].[http://sensor.berkeley.edu/] (accessed on 05-May-15)
- [Consortium of California Herbaria].[The University and Jepson Herbaria].[http://ucjeps.berkeley.edu/] (accessed on 05-May-15)
Can I create my own application using Holos data?
Yes! Built on the Django REST framework, Ecoengine is a self-documenting API that will return data in JSON, GeoJSON, CSV and other data formats. Developers can see the full documentation and tips on our how to get the most out of our Ecoengine API at this link: https://ecoengine.berkeley.edu/docs/.
Can I see my own data with Holos?
Yes! The Compare tool will visualize any sample data stored in a GeoJSON format. These can be stored in third-party GIS hosting sites like CartoDB, then copy and paste in the URL for your GeoJSON data into Compare tool’s Add button to see your data set with Ecoengine’s.
For further questions, email us at: ecoengine[at]berkeley.edu
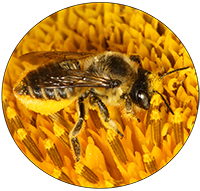
 California’s Ticks and Bees
With Ecoengine funding, the Essig Museum hired students to image, recurate, and database 700+ tick specimens collected in California over the last century by Professors Deane Furman and Robert Lane. These specimens are being used by researchers to further understand the complex interactions between Sudden Oak Death (SOD), Lyme disease, ticks and tick hosts.
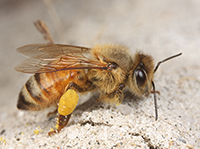
Another Berkeley Global Change project led by Professor Neil Tsutsui is examining how bees, pathogens, plants, and pollination activities have changed in response to urbanization and agricultural land conversion. To help select appropriate specimens for the study, the Ecoengine team georeferenced 2000+ Apis melifera records and integrated data from 8000+ specimens of native and non-native bee species collected by Professor Gordon Frankie‘s lab from urban bee gardens across California.
In addition, through a collaboration with the CalBug project and Joan Ball-Damerow, we are serving the most complete data set ever published (over 32,000 records) on the damselflies and dragonflies (Odonata) of California. Combined with habitat, climate, and hydrology data, these records illustrate shifts in Odonata distribution relative to environmental change over the past 100+ years.
 |
 |
 |
 |
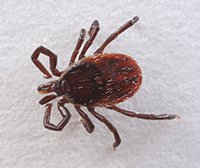
| Ixodes pacificus, the main carrier of Borrelia burgdorferi bacteria which causes lyme disease. Photo by Joyce Gross |
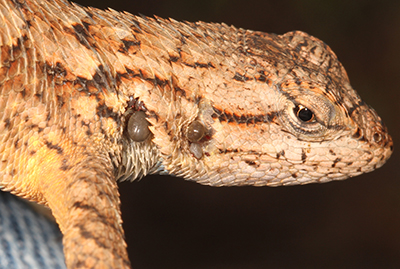
Sceloporus occidentalis, a carrier of Ixodes pacificus, has borreliacidal factor in its blood. Photo by Joyce Gross |
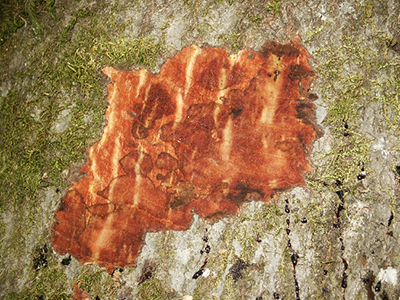
Bark of a Quercus agrifola infected with Phytophthora ramorum, the caustive agent of Sudden Oak Death. Loss of oak habitat alters prevalence of tick carriers, such as Sceloporus. Photo by Ted Swiecki |
Apis mellifera commonly known as the honey bee photo by Joyce Gross |
Relevant Publications

The Ecoengine serves many different data types in an flexible mapping interface. For the first time, data from the University of California Natural Reserve System has been integrated with Wieslander Vegetation Mapping Project, CalPhotos and Berkeley Natural History Museums specimens. This combination of resources gives a holistic view of the natural history of California and beyond.
To view a complete list of the data sets that are being served through the mapping API, please see the Data Sources page.
To view a list of institutions that are contributing data, please see the Participating Institutions page.
We invite users to browse our tutorials and discover data connections with the Explore and Compare Tools.
The Ecoengine provides a flexible platform for querying and visualizing data. We encourage developer innovation through the D3, Python and R packages under Code Examples.
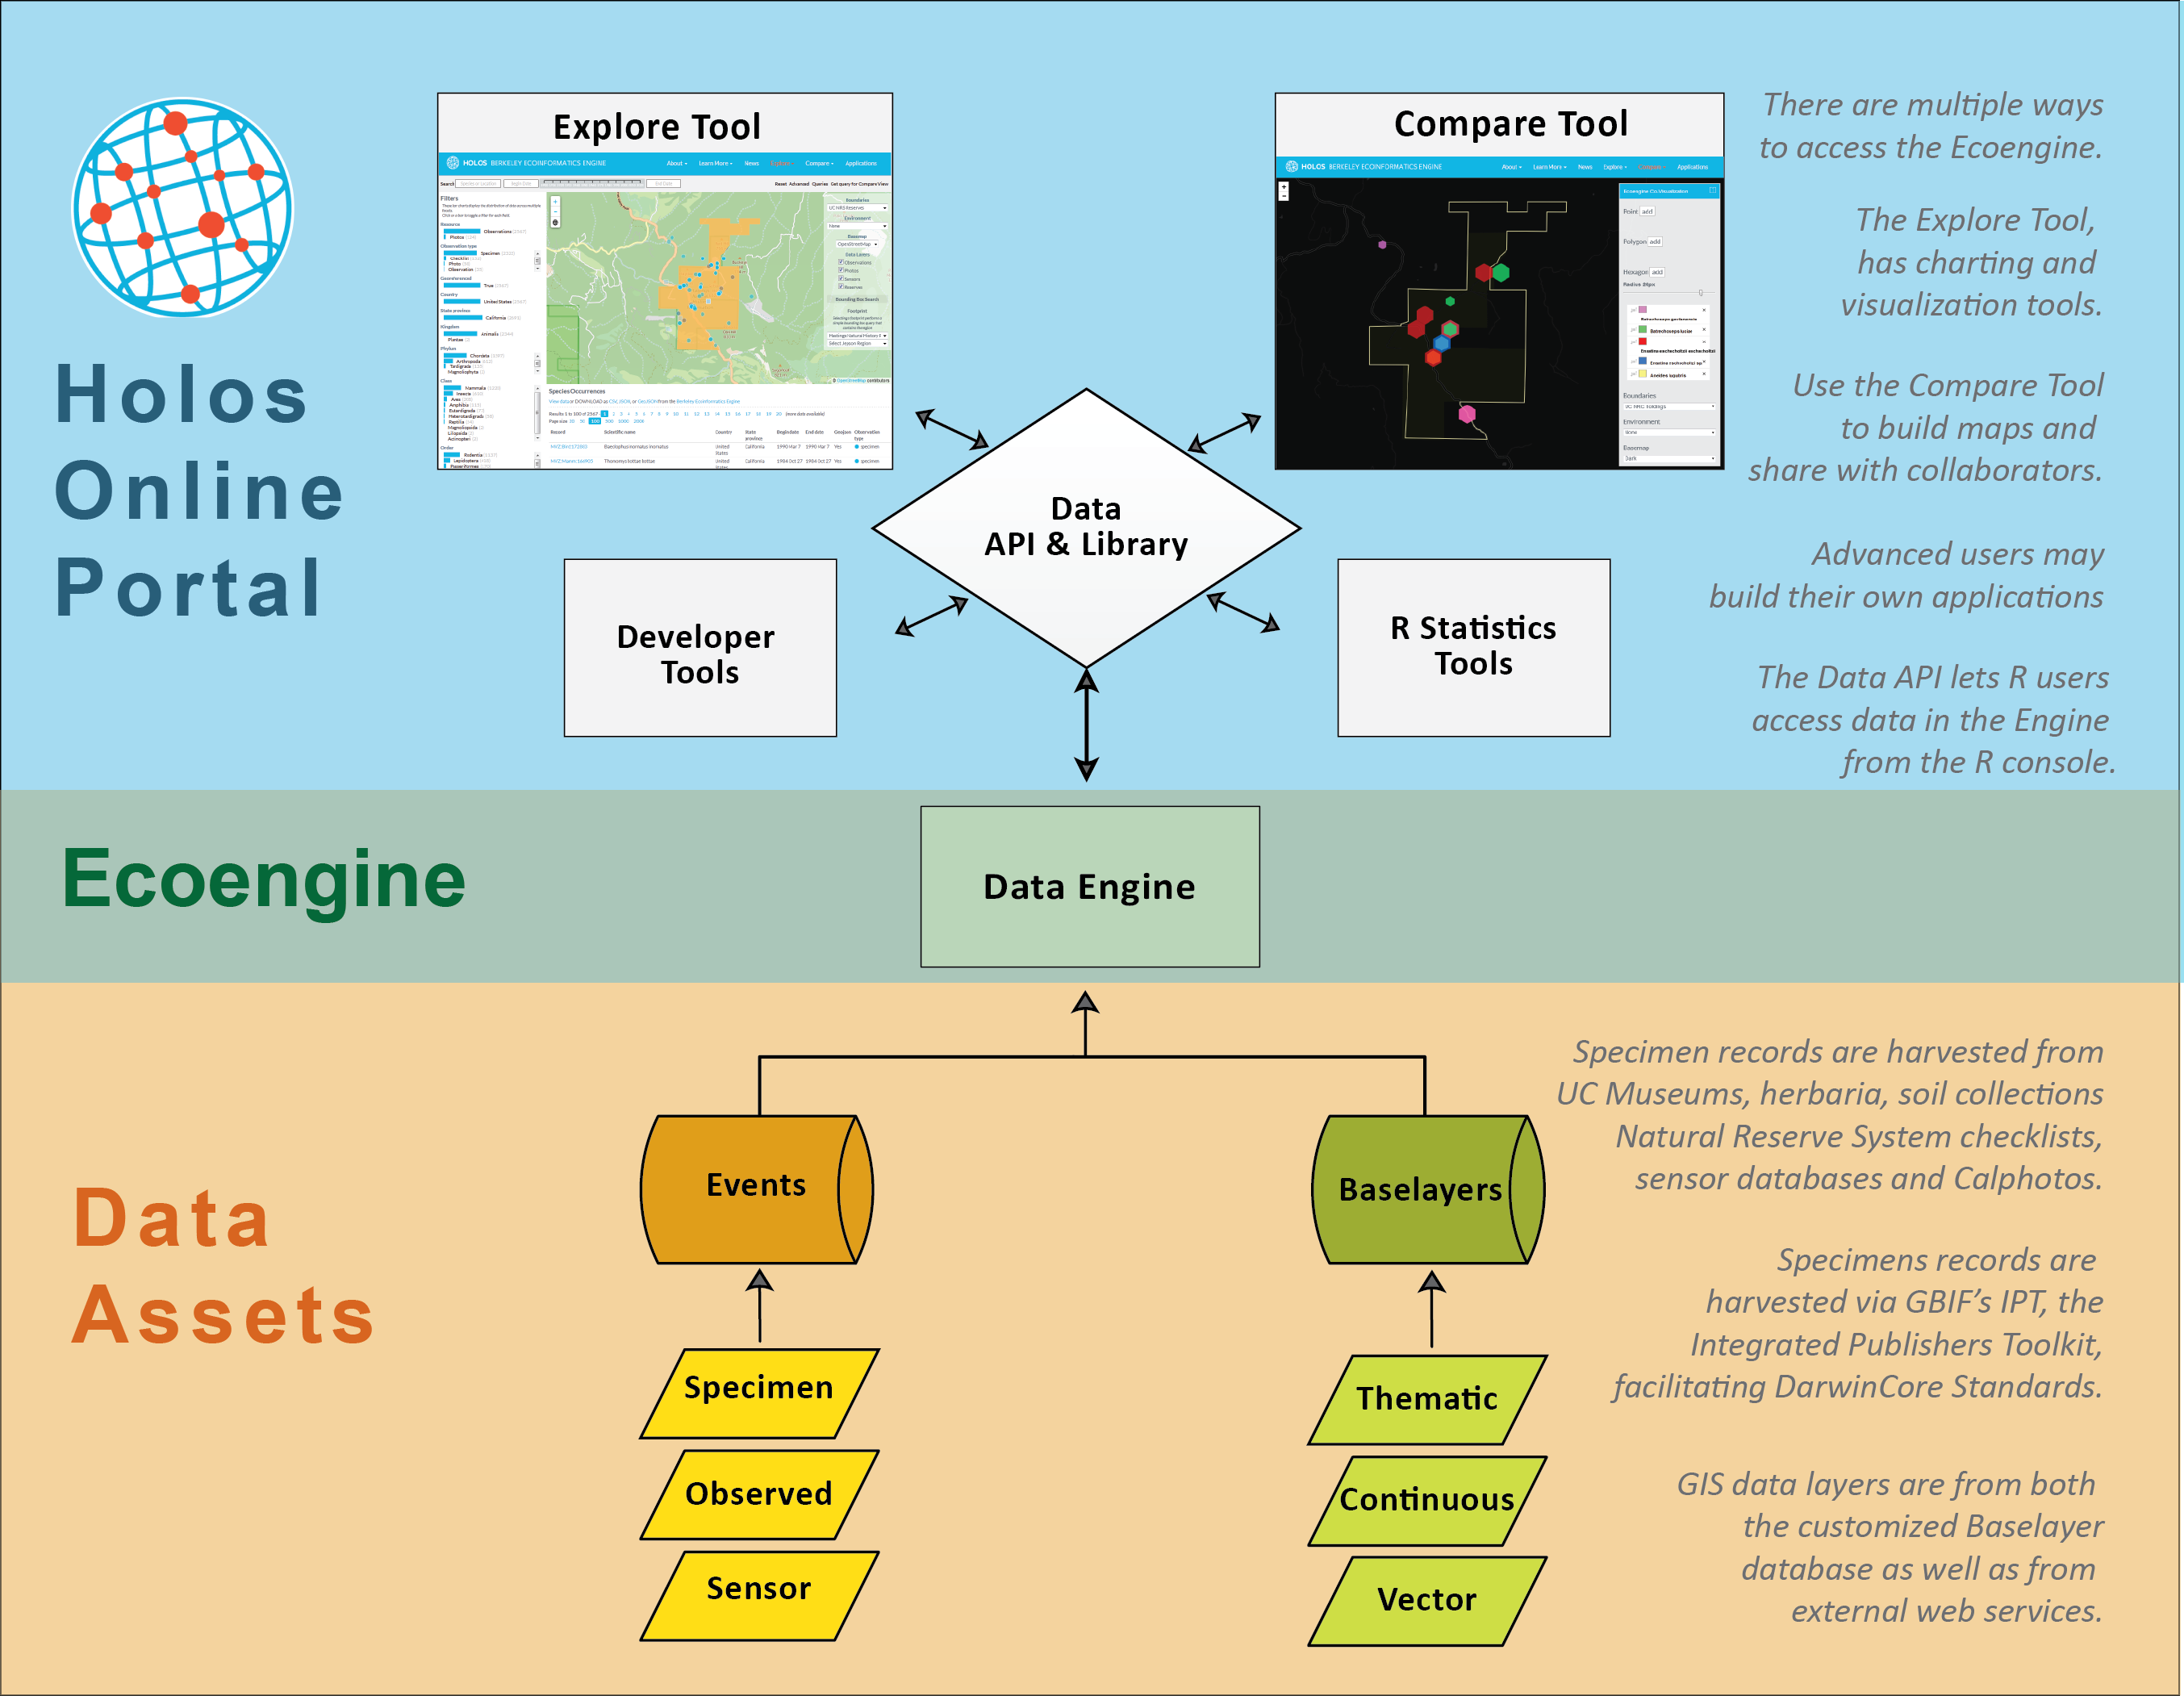 |
| Diagram of data structure of Holos. The Ecoengine (center) is accessible through the Ecoengine API (top, center). The entry points include two mapping and visualization tools; the Explore Tool (top left), which has search and filtering functions, and the Compare Tool (top right) which allows you to import results from Explore and make comparative maps for sharing. The API is also accessible through Developer Tools and through the ROpenSci package. |
A significant goal of the Berkeley Ecoinformatics Engine project was to uncover “dark” data, mobilize isolated collections, and digitize targeted specimens within the Berkeley Natural History Museums and Berkeley’s research labs. The collections listed below were recovered, organized, databased, georeferenced, connected and/or made available for public use by our staff and undergraduate students. These data become available for exploration in the Explore and Compare tools.
Click on the links below to explore the story behind each collection, projects and relevant research, and the people who brought them to “light.”


|
|
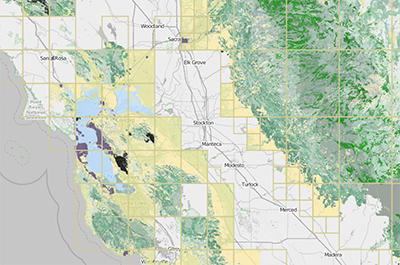
| Map of UC NRS locations with UCB’s four field stations contributing data to Ecoengine in yellow, other UC field stations in white. |

Species Checklists from Reserves and Field Stations
UC Berkeley has six reserves and field stations, four of which (Angelo Coast Range Reserve, Blue Oak Ranch Reserve, and Hastings Natural History Reservation, and Sagehen Creek Field Station) were the focus of the Ecoengine’s first efforts in integrating species lists with specimen data.
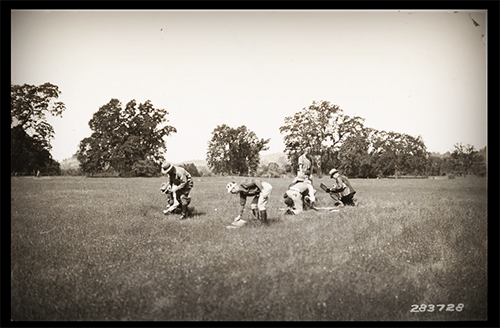
We uncovered 70 current and historic species check lists accounting for nearly 3,000 occurance events from across the four stations. These lists range from the 1930s to present day and span multiple taxa – insects, birds, plants, fungi, and more. These species lists were a high priority for our digitization; they are typically detailed, providing a long record of occurrences at specific sites. To integrate UC Natural Reserve System (NRS) data into the Ecoengine, we created an online catalog system to compile them.
Ecoengine students databased, updated nomenclature, and georeferenced the species lists.
While searching the primary literature for the species lists, the Ecoengine partnered with the NRS to help revise and update its bibliography which can be accessed here.
Data sets from research done in the National Reserve System have also been digitized and cataloged. In our catalog, you will find metadata on climate and weather station measurements, studies on species occurences, surveys, trap lines, behavior, and habitat preferences, vegetation plot data, historic and current images, long-term monitoring experiments, graduate research and much more. The richness of these first-person accounts has proven especially critical to resurvey efforts that establish benchmarks from which we can measure the nature of recent global change (e.g., the NSF funded Grinnell Resurvey Project). For many of these datasets the basic metadata details are unknown (e.g., dates of sampling, experimental protocol, etc.) and the majority are not in digital form. We built an online metadata catalog to document and assess each dataset and are using this catalog to assess their value and priority for digitization. Some of these data are currently available in the ecoengine. The full data set is available through the Berkeley initiative on Global Change Biology (BiGCB) at BiGCB Informatics.
Ecoengine Online Catalog Database Access
 Vertebrates and Invertebrates from the Pleistocene and Holocene
Students employed by the Ecoengine project cataloged and georeferenced 31,328 Pleistocene and Holocene vertebrate and invertebrate fossils. Most of these fossils localities were predominantly from California. These newly digitized records comprise approximately 6% of all georeferenced records in the UCMP database and are now available for mapping and modeling through the Explore Tool under Observation Type: Fossils.
 |
| Quercus fossil photo by Robert A. Stevenson |

“The Museums” natural history collection at UC Berkeley 1873 prior to BNHM and MVZ. photo by O.V. Lange
The Musem of Vertbrate Zoology (MVZ) is a research collection within University of California Berkeley located in the Valley Life Sciences Building with the other Berkeley Natural History Museums (BNHM). The MVZ, founded in 1908, houses one of the most important collections of birds, mammals, reptiles and amphibians on the west coast. The collections currently include over 700,000 records from all over the world. Supporting a vibrant reserach community, the historical collections have been integral to our understanding of how animals adapt to a changing climate.
Currently, these MVZ collections are available to search through the Ecoengine:
- Bird Collection
- Bird Observatons
- Egg and Nest Collection
- Herpetological Collection
- Herpetological Observations
- Mammal Collection
- Mammal Observations
- Hildebrand Collection
The Vegetation Type Mapping Homepage lets users explore vegetation, plot, and photo data from the Wieslander Vegetation Type Mapping project. In the 1920s and 1930s Albert Everett Wieslander and several others explored much of California’s wilderness sampling vegetation, taking photographs, collecting plant specimens, and drawing detailed maps of what they found. These data represent a snapshot of California’s vegetation in the early 20th century, and are a valuable resource for comparative and conservation ecology. This website has more information about the collection, detailed information about using the data, and data downloads.
The Ecoengine API has endpoints that can be accessed by a variety of tools. In addition to the applications featured on the Holos Homepage, this page catalogs additional use cases and sites demonstrating the use of the Berkeley Ecoengine.
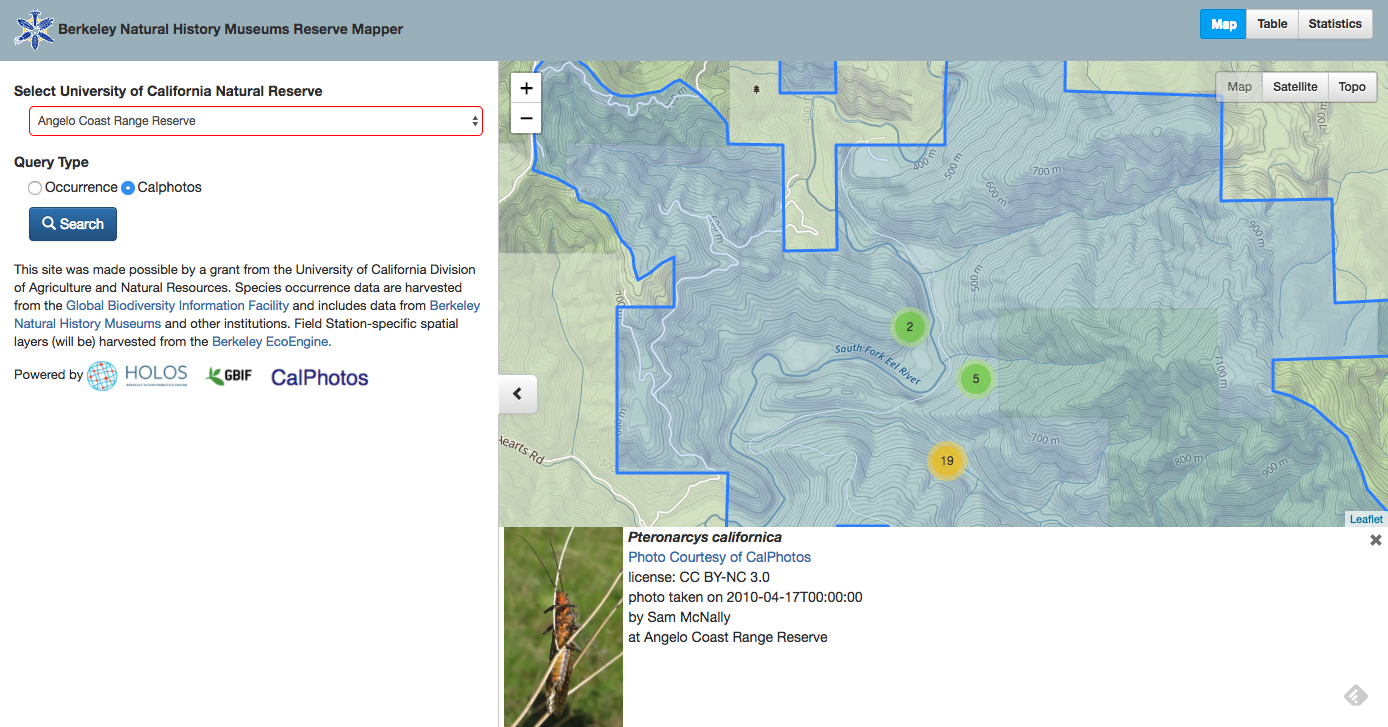
The reservemapper application helps users discover natural history observations, specimens, and photos associated with reserves, parks, and special districts. Select one of the following links to populate reservemapper with agency specific reserves, units, or parks:
University of California Natural Reserves
California Department of Forestry and Fire Protection
California Department of Fish and Wildlife
United States Forest Service (California units)
United States National Parks (California units)
United States Army Corps of Engineers (California units)
The reservemapper draws on data from the Berkeley EcoEngine, with species occurrence data hosted by the Global Biodiversity Information Facility (GBIF) and photos of plants, animals, fossils, people, and landscapes from CalPhotos.